
· 5 min read
Rahul Joshi
info

TL;DR: Trying to become more user-centric and make data driven decisions? Get started with the SQL source pipeline + BigQuery + Metabase

When you have a web and / or mobile app but no data yet

If you're a startup without a dedicated data team but a sizeable number of users on your website or mobile app, then chances are that you are collecting and storing all your product data in OLTP databases like MySQL, Postgres, etc. As you have grown, you have likely been aiming to become more user-centric, yet you find that no one at your company has information on what your users do or what their experience is like. Stakeholders should be making data-driven decisions, but they are not yet because they are unable to use the existing data to understand user behavior and experience. This is usually the point when folks realize they need a data warehouse.

Why a data warehouse is necessary

OLTP databases are great because they are optimized to handle high-volume real-time transactions and maintain data integrity and consistency. However, they are not very well-suited for advanced analytics and data modelling. If you want to create reports, dashboards, and more that help you understand you users, you are going to want to extract, load, and transform (ELT) into a OLAP database like Google BigQuery, Snowflake, etc. To do this, you will need to create a data pipeline, which can be quite challenging if your company does not have a dedicated data engineering team.

Why a data pipeline is necessary

Production dashboards rely on the availability of consistent, structured data, which necessitates deploying a data pipeline that is idompotent, can manage the schema and handle schema changes, can be deployed to load data incrementally, etc. For most startups, it's not obvious how to create such pipelines. This is why we decided to demonstrate how one can set up such a data pipeline and build analytics dashboards on top of it.

Why a reporting tool is necessary

We chose to build our dashboard in Metabase because it also offers an open source edition. The advantage of reporting tools like Metabase is that they are easy and intuitive to use even for people who can't write SQL, but at the same time they are powerful enough for those who would like to use SQL.

How we set this up

1. Creating a PostgreSQL -> BigQuery pipeline

Our aim was to create a Metabase dashboard to explore data in a transactional database. The data set that we chose was a sample of The Dell DVD Store 2 database, which we put into a Postgres database deployed on a Google Cloud SQL instance. To make this data available to Metabase, we needed to first load all of the data into a BigQuery instance, and for this we needed a data pipeline. We created this pipeline by doing very simple customizations on the existing dlt sql_database pipeline. See the accompanying repo for the steps we followed.

2. Building a Metabase reporting dashboard

With the database uploaded to BigQuery, we were now ready to build a dashboard. We created a Metabase cloud account and connected it to our BigQuery instance. This made the whole database accessible to Metabase and we were able to analyze the data.

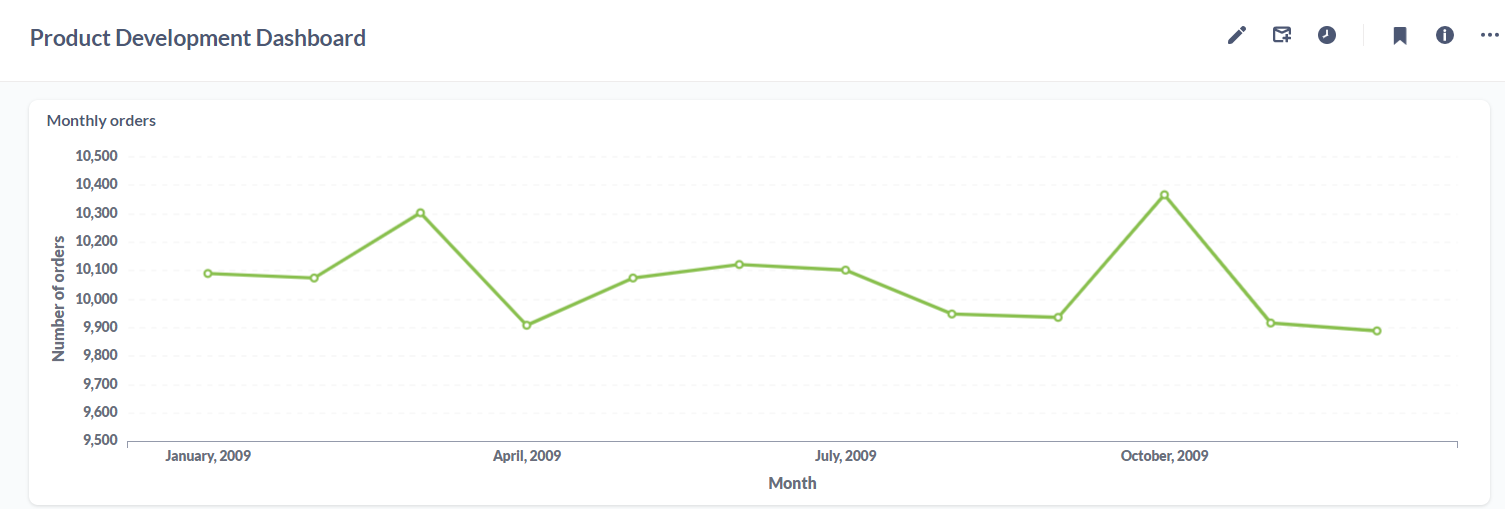
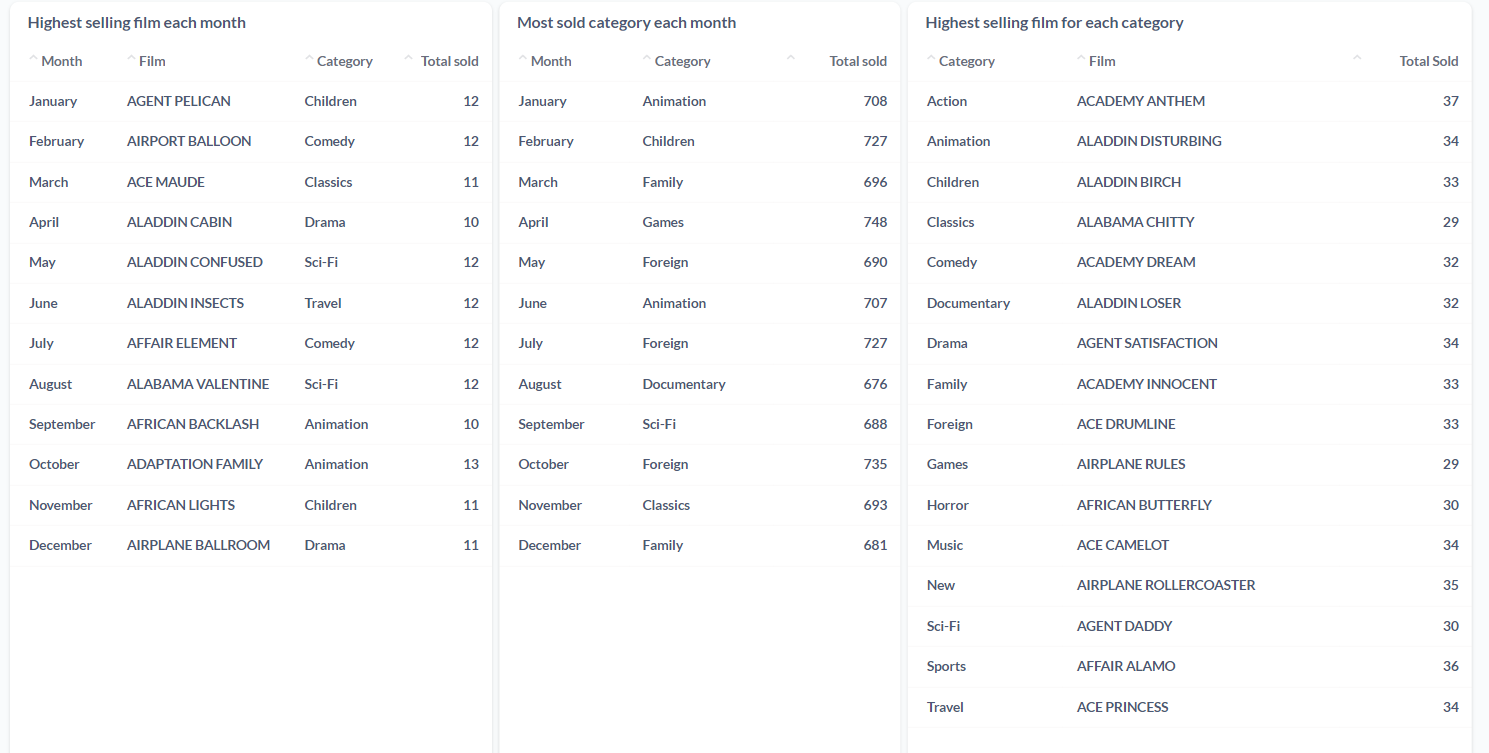
The DVD store database contains data on the products (film DVDs), product categories, existing inventory, customers, orders, order histories etc. For the purpose of the dashboard, we decided to explore the question: How many orders are being placed each month and which films and film categories are the highest selling?

orders_chart.png top_selling_tables.png 
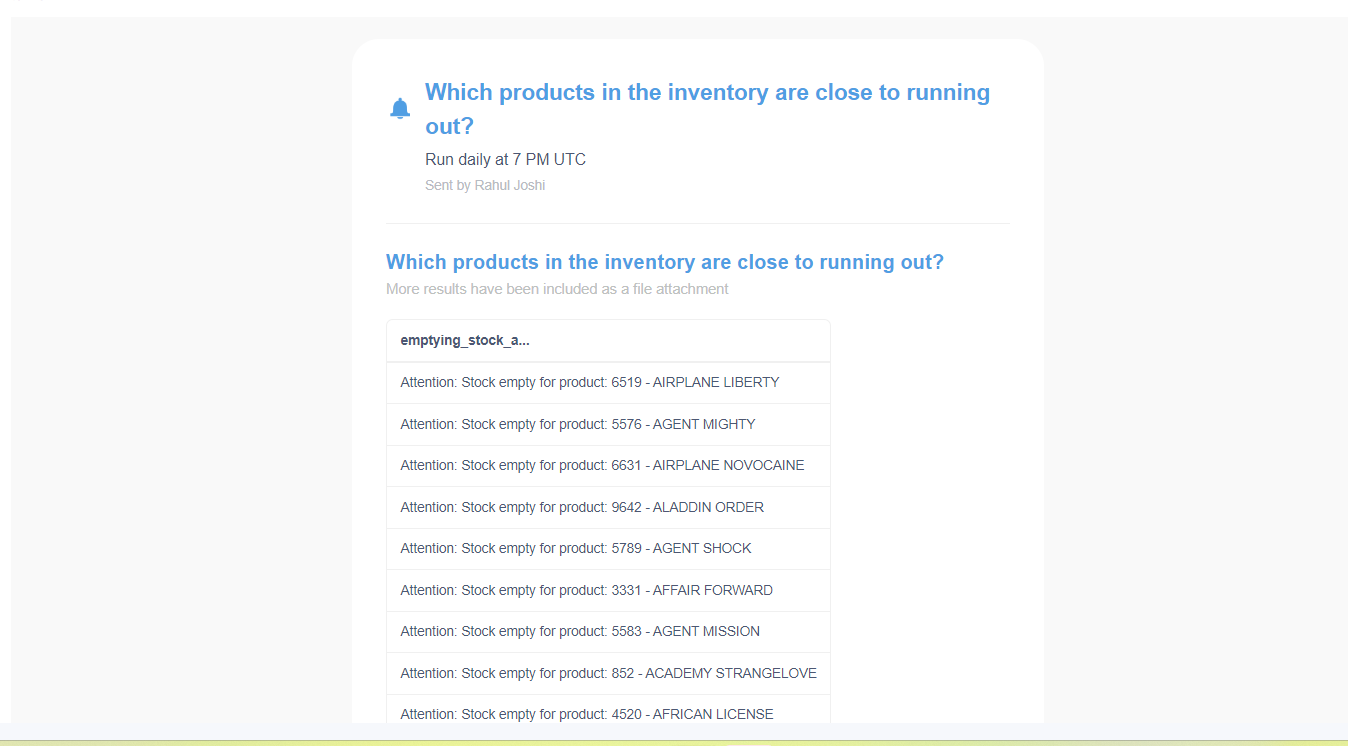
In addition to this, we were also able to set up email alerts to get notified whenever the stock of a DVD was either empty or close to emptying.

low_stock_email_alert.png

3. Deploying the pipeline

With our dashboard ready, all we had to do was deploy our pipeline so that the dashboard could get updated with new data daily. Since the dashboard only uses some of the tables, we needed to modify the pipeline, that was configured to load the entire database, to instead only update the necessary tables. We also wanted to make it possible for the pipeline to load tables incrementally whenever possible.

We first started by selecting the tables that we wanted to update, namely: orders, orderlines, products, categories, inventory. We then decided whether we wanted to update the tables incrementally or with full replace:

  • Tables orders and orderlines contain data on the orders placed. This means that they also contain a date column and hence are loaded incrementally every day.
  • Tables products, categories, and inventory contain information on the existing products. These tables don't contain a date column and are updated whenever there is any change in inventory. Since the values of the existing data in the tables can change, these tables are not updated incrementally, but are instead fully loaded each time the pipeline is run.

In order to specify these conditions and deploy our pipeline in production, we followed these steps.

· 4 min read
Rahul Joshi
info

TL;DR: We created a Hacker News -> BigQuery dlt pipeline to load all comments related to popular ELT keywords and then used GPT-4 to summarize the comments. We now have a live dashboard that tracks these keywords and an accompanying GitHub repo detailing our process.

Motivation

To figure out how to improve dlt, we are constantly learning about how people approach extracting, loading, and transforming data (i.e. ELT). This means we are often reading posts on Hacker News (HN), a forum where many developers like ourselves hang out and share their perspectives. But finding and reading the latest comments about ELT from their website has proved to be time consuming and difficult, even when using Algolia Hacker News Search to search.

So we decided to set up a dlt pipeline to extract and load comments using keywords (e.g. Airbyte, Fivetran, Matillion, Meltano, Singer, Stitch) from the HN API. This empowered us to then set up a custom dashboard and create one sentence summaries of the comments using GPT-4, which made it much easier and faster to learn about the strengths and weaknesses of these tools. In the rest of this post, we share how we did this for ELT. A GitHub repo accompanies this blog post, so you can clone and deploy it yourself to learn about the perspective of HN users on anything by replacing the keywords.

Creating a dlt pipeline for Hacker News

For the dashboard to have access to the comments, we needed a data pipeline. So we built a dlt pipeline that could load the comments from the Algolia Hacker News Search API into BigQuery. We did this by first writing the logic in Python to request the data from the API and then following this walkthrough to turn it into a dlt pipeline.

With our dlt pipeline ready, we loaded all of the HN comments corresponding to the keywords from January 1st, 2022 onward.

Using GPT-4 to summarize the comments

Now that the comments were loaded, we were ready to use GPT-4 to create a one sentence summary for them. We first filtered out any irrelevant comments that may have been loaded using simple heuritics in Python. Once we were left with only relevant comments, we called the gpt-4 API and prompted it to summarize in one line what the comment was saying about the chosen keywords. If you don't have access to GPT-4 yet, you could also use the gpt-3.5-turbo API.

Since these comments were posted in response to stories or other comments, we fed in the story title and any parent comments as context in the prompt. To avoid hitting rate-limit error and losing all progress, we ran this for 100 comments at a time, saving the results in the CSV file each time. We then built a streamlit app to load and display them in a dashboard. Here is what the dashboard looks like:

dashboard.png

Deploying the pipeline, Google Bigquery, and Streamlit app

With all the comments loaded and the summaries generated in bulk, we were ready to deploy this process and have the dashboard update daily with new comments.

We decided to deploy our streamlit app on a GCP VM. To have our app update daily with new data we did the following:

  1. We first deployed our dlt pipeline using GitHub Actions to allow new comments to be loaded to BigQuery daily
  2. We then wrote a Python script that could pull new comments from BigQuery into the VM and we scheduled to run it daily using crontab
  3. This Python script also calls the gpt-4 API to generate summaries only for the new comments
  4. Finally, this Python script updates the CSV file that is being read by the streamlit app to create the dashboard. Check it out here!

Follow the accompanying GitHub repo to create your own Hacker News/GPT-4 dashboard.

· 3 min read
Rahul Joshi
info

TL;DR: As of last week, there is a dlt pipeline that loads data from Google Analytics 4 (GA4). We’ve been excited about GA4 for a while now, so we decided to build some internal dashboards and show you how we did it.

Why GA4?

We set out to build an internal dashboard demo based on data from Google Analytics (GA4). Google announced that they will stop processing hits for Universal Analytics (UA) on July 1st, 2023, so many people are now having to figure out how to set up analytics on top of GA4 instead of UA and struggling to do so. For example, in UA, a session represents the period of time that a user is actively engaged on your site, while in GA4, a session_start event generates a session ID that is associated with all future events during the session. Our hope is that this demo helps you begin this transition!

Initial explorations

We decided to make a dashboard that helps us better understand data attribution for our blog posts (e.g. As DuckDB crosses 1M downloads / month, what do its users do?). Once we got our credentials working, we then used the GA4 dlt pipeline to load data into a DuckDB instance on our laptop. This allowed us to figure out what requests we needed to make to get the necessary data to show the impact of each blog post (e.g. across different channels, what was the subsequent engagement with our docs, etc). We founded it helpful to use GA4 Query Explorer for this.

Internal dashboard

Dashboard 1 Dashboard 2

With the data loaded locally, we were able to build the dashboard on our system using Streamlit. You can also do this on your system by simply cloning this repo and following the steps listed here.

After having the pipeline and the dashboard set up just how we liked it, we were now ready to deploy it.

Deploying the data warehouse

We decided to deploy our Streamlit app on a Google Cloud VM instance. This means that instead of storing the data locally, it would need to be in a location that could be accessed by the Streamlit app. Hence we decided to load the data onto a PostgreSQL database in the VM. See here for more details on our process.

Deploying the dlt pipeline with GitHub Actions

Once we had our data warehouse set up, we were ready to deploy the pipeline. We then followed the deploy a pipeline walkthrough to configure and deploy a pipeline that will load the data daily onto our data warehouse.

Deploying the dashboard

We finally deployed our Streamlit app on our Google Cloud VM instance by following these steps.

Enjoy this blog post? Give dlt a ⭐ on GitHub 🤜🤛

· 3 min read
Matthaus Krzykowski

Using DuckDB, dlt, & GitHub to explore DuckDB

tip

TL;DR: We created a Colab notebook for you to learn more about DuckDB (or any open source repository of interest) using DuckDB, dlt, and the GitHub API 🙂

So is DuckDB full of data about ducks?

Nope, you can put whatever data you want into DuckDB ✨

Many data analysts, data scientists, and developers prefer to work with data on their laptops. DuckDB allows them to start quickly and easily. When working only locally becomes infeasible, they can then turn this local “data pond” into a data lake, storing their data on object storage like Amazon S3, and continue to use DuckDB as a query engine on top of the files stored there.

If you want to better understand why folks are excited about DuckDB, check out this blog post.

Perhaps ducks use DuckDB?

Once again, the answer is also 'nein'. As far as we can tell, usually people use DuckDB 🦆

To determine this, we loaded emoji reaction data for DuckDB repo using data load tool (dlt) from the GitHub API to a DuckDB instance and explored who has been reacting to issues / PRs in the open source community. This is what we learned…

The three issues / PRs with the most reactions all-time are

  1. SQLAlchemy dialect #305
  2. Add basic support for GeoSpatial type #2836
  3. Support AWS default credential provider chain #4021

The three issues / PRs with the most reactions in 2023 are

  1. Add support for Pivot/Unpivot statements #6387
  2. Add support for a pluggable storage and catalog back-end, and add support for a SQLite back-end storage #6066
  3. Add support for UPSERT (INSERT .. ON CONFLICT DO ..) syntax #5866

Some of the most engaged users (other than the folks who work at DuckDB Labs) include

All of these users seem to be people. Admittedly, we didn’t look at everyone though, so there could be ducks within the flock. You can check yourself by playing with the Colab notebook.

Maybe it’s called DuckDB because you can use it to create a "data pond" that can grow into a data lake + ducks like water?

Although this is a cool idea, it is still not the reason that it is called DuckDB 🌊

Using functionality offered by DuckDB to export the data loaded to it as Parquet files, you can create a small “data pond” on your local computer. To make it a data lake, you can then add these files to Google Cloud Storage, Amazon S3, etc. And if you want this data lake to always fill with the latest data from the GitHub API, you can deploy the dlt pipeline.

Check this out in the Colab notebook and let us know if you want some help setting this up.

Just tell me why it is called DuckDB!!!

Okay. It’s called DuckDB because ducks are amazing and @hannes once had a pet duck 🤣

Why "Duck" DB? Source: DuckDB: an Embeddable Analytical RDBMS

Enjoy this blog post? Give data load tool (dlt) a ⭐ on GitHub here 🤜🤛

· 9 min read
Matthaus Krzykowski

Summary

The excitement around DuckDB has steadily increased over the last year. The project has consistently crossed the 1M downloads per month mark over the last three months (Dec ‘22, Jan ‘23, Feb ‘23), a large increase from the ~250k downloads per month in February ‘22.

Like so many others, we are excited about the project, too. Recently, we attended the DuckDB conference and spoke with many members of the community to learn why people are excited about it. We examined issues on GitHub, interviewed some of the top contributors to the project, and even experimented with DuckDB ourselves to determine how we could contribute.

We aimed to identify the most popular reasons why people try out DuckDB with our research. We found five perspectives that people commonly have when trying out DuckDB.

Marcin watching a MotherDuck presentation

dltHub co-founder Marcin watching a MotherDuck presentation at DuckCon in Brussels in February

1) "Normie" users love to drop-In DuckDB in all sorts of places

Last December, folks from the data + ML community organized a great conference, Normconf. Presenters and attendees were invited to share stories about everyday data problems and celebrate solutions. Many of the attendees referred to themselves as "normies" during the conference. We have found many of these folks overlap with those trying out DuckDB.

Normies have a specific way of solving problems that breaks some behavior patterns and expectations of previous generations of software engineers. As Ben Labaschin explains in his presentation Building an HTTPS Model API for Cheap: AWS, Docker, and the Normconf API, “normie software” has the following criteria:

  • It does not require domain knowledge to use. You should need almost no documentation because time is most important and all learning is investment. Before you learn, you need to know if it will pay off in the future.
  • The best tools can be reused in many contexts. You learn them once, and you can apply them everywhere.
  • Tools should work together. You should pick the tool that works with your other tools.

Many at Normconf agreed that DuckDB is also a “normie tool”. It has a Python wrapper and can be dropped into any Python script, notebook, or Streamlit app. It has helpers and integrates with other libraries that are part of typical workflows (e.g. Pandas, Parquet, Arrow, etc). It is a powerful analytical database and brings local SQL execution without credentials and other hassles. You can scan data from and export data to Parquet, CSV, or JSON and query an S3 bucket directly.


2) Local Data Workflows Are Going Mainstream, and DuckDB Is at the Center

Many people struggle to access cloud data warehouses within their organizations. Some of the problems that these users encounter include:

  1. Painful processes to obtain credentials and permissions
  2. A setup that is perceived as "difficult"
  3. Deployment of local composer files
  4. Working on remote machines is often much less pleasant

Instead they often use DuckDB to load data locally. DuckDB enables people to start using data by:

  1. Allowing them to learn SQL and try examples without any setup
  2. Querying GCP or S3 buckets from a local machine
  3. Creating notebooks or data apps with embedded DuckDB that showcase their work

Prototyping and experimenting with production data locally on DuckDB is a popular practice. From what we learned, deployment of DuckDB to production is still quite rare. Companies seldom use local workflows as this depends on someone having their laptop turned on to function. However, many non-engineering personnel use DuckDB to access production data.

3) The community is exploring various ways to use DuckDB's columnar query engine (e.g. analytics)

As many people in the community are exploring how DuckDB could be used, the fact that the DuckDB engine provides a way to quickly query the columnar format seems to be central to multiple use cases.

In data processing and usage, there are two types of transformations:

  • Non-time-critical, usually nightly, "transformation" jobs. These are run programmatically, the output is saved somewhere, and a business person consumes this output on demand a few hours or days later
  • Time-critical "dashboard user access" jobs. A report is created as output from the former job. Now, a user wants to gain insights from it "on demand", so they aggregate this table and wait. This computation is now time-critical, because the user is actively waiting for it

Row-based engines like Postgres are great at the first type of job, which usually involves many joins and row-based operations. However, they are not fast at aggregating data sets, as this requires them to iterate over rows by index (access the row, find its value, sum it).

Column-based engines, such as DuckDB, the Postgres AlloyDB engine, MySQL Percona, Redshift, etc., excel at aggregation jobs, which, for example, count or sum elements in a column.

Here, we have found evidence of two use cases where DuckDB is particularly suited:

  1. Aggregation of event data (e.g. product analytics). A dump of events could be easily scanned and aggregated into "users", "sessions", counted, etc. By using a database architecture like an "activity schema" and a way to tag events, this would make a great "product analytics" embedded warehouse. The MotherDuck team explains some reasons why to use DuckDB for analytics here.
  2. Aggregation of "one big table" architectures that use "one big table" instead of a dimensional model. This is a common design pattern for organizations that do not tackle data architecture, such as small analyst teams.

The amount of data processed for analytics workloads is often smaller than people think, with dashboards typically built from aggregated data. The co-founder of Motherduck suggests that a past analysis of his of BigQuery queries found that 90% of queries in organisations processed less than 100 MB of data (while the co-founder of Ponder kind of disagrees). Many people load CSV, Parquet, and JSON files sizes ranging from 50 to 200M rows into DuckDB. This includes not only one-off data loading but also ongoing demo projects. Common advantages of DuckDB we frequently heard about are speed, costs, and the usability advantages mentioned above.

4) With DuckDB users bring the database engine to their data and instead of the other way around

For most of us this behavioural pattern should ring true:

  1. “I have my data where I see fit. For example, in a AWS S3 bucket or on my laptop. My workflows deal with this well. And the workflow is fairly simple and cheap.”
  2. “Now I want to process my data.”
  3. “So I move my data to where a database engine is. I load it somewhere. I load it to Snowflake, BigQuery, Redshift. This is more complicated and costs significantly.”

We encountered a different related pattern with DuckDB users. DuckDB users often bring the engine to their data:

  1. People drop it into AWS Lambda or Google Cloud Function to process data close to the engine. The few DuckDB production deployments that we have seen were all AWS Lambda centric. You can read a general example here
  2. The product that makes this pattern super easy for AWS is Boiling Data. The product also scales fairly well

The community frequently experiments with making such a setup work. In a recent post from frequent DuckDB issue contributor Mimoune Djouallah, he describes how he used Azure Storage, DuckDB, and an Azure ML Notebook to build a cost-effective data engineering pipeline for smaller data workloads. The pipeline involves reading data from Azure Storage, running complex queries, and saving the results in a bucket. The resulting bucket can be consumed in Synapse Serverless/PowerBI/Notebook, etc. We wonder, just like Mimoune and others do, if vendors will be building more support for smaller data workloads going forward.

It is probably worth mentioning at this stage that DuckDB and even PostgreSQL are not databases in the traditional sense. Rather, they are relational "database" management systems (RDBMS) that manage structured collections of data. While both can be used for querying internally stored data and reading external data like files or federated databases, DuckDB focuses primarily on the latter.

This means that it functions more as an RDBMS without an attached database. Therefore, it is inaccurate to refer to DuckDB as a database. Instead, we should consider the parquet file or data lake as the actual database, with DuckDB serving as a tool for managing and querying the data.

5) Some people are dropping DuckDB into their BI tooling

A few people people we met have chosen to have always-up file storage and on-demand DuckDB embedded in a BI tool. A BI tool that supports this use case is Metabase. It’s an interesting concept that might one day lead to a stable open source BI tool SQL cache.

This is different than the past. Classic business intelligence tools use the OLAP concept—the business user creates a pivot table, and the tool composes a SQL query automatically and issues it to the database. This slows things down and adds additional cost. Think about Data Studio doing queries on BigQuery just because you change the granularity.

If the part of the data is cached (in-memory or as temporary parquet file) and the BI tool has an embedded query engine, it can do following tricks, for free and in no-time:

  • change the granularity of a time dimension between different units (hour, day, week, calendar week, US calendar week, etc.)
  • drill downs, drill throughs, and filters
  • leveraging joins through predefined paths or UI query builders

· 3 min read
Matthaus Krzykowski

The number of Python developers increased from 7 million in 2017 to 15.7 million in Q1 2021 and grew by 3 million (20%) between Q4 2021 and Q1 2022 alone, making it the most popular programming language in Q3 2022. A large percentage of this new group are what we call Python practitionersdata folks and scripters. This group uses Python to do tasks in their jobs, but they do not consider themselves to be software engineers.

They are entering modern organizations in masse. Organizations often employ them for data-related jobs, especially in data engineering, data science / ML, and analytics. They must work with established data sources, data stores, and data pipelines that are essential to the business of these organizations These companies, though, are not providing them with the type of tooling they learnt to expect. There’s no “Jupyter Notebook, pandas, NumPy, etc. for data loading” for them to use.

At this stage of dlt we are focused on serving the needs of organizations with 150 employees or less. Companies of this size typically begin making their first data hires. They want data to be at their core: their CEOs may want to make their companies more “data driven” and “user feedback centric”. Their CTOs may want to “build a data warehouse for automation and self service”. They frequently are eager to take advantage of the skills of the Python practioners they have hired.

To achieve our mission of making this next generation of Python users autonomous in these organizations, we believe we need to build dlt in a “Pythonic” way. Anyone that can write a loop in Python script should be able to write a source and load it. There should minimal learning curve. Anyone in these organizations that gets basic Python should be able to use dlt right away.

However, we also recognize the need dlt to be loved not only by Python users but also data engineers to fulfill our mission. This is crucial because eventually these folks will be brought in to help with data loading in an organization. We need data engineers to evolve dlt pipelines rather than ripping them out and replacing them like they almost always do to scripts written by Python practitioners today.

To develop with dlt, anyone can install it like any other Python library with pip install dlt. They can then run dlt init and be ready to go. Already today data engineers love the automatic schema inference and evolution as well as the customizability of dlt.

· 3 min read
Matthaus Krzykowski

dltHub Mission

Since 2017, the number of Python users has been increasing by millions annually. The vast majority of these people leverage Python as a tool to solve problems at work. Our mission is to make this next generation of Python users autonomous when they create and use data in their organizations. For this end, we are building an open source Python library called data load tool (dlt).

These Python practitioners, as we call them, use dlt in their scripts to turn messy, unstructured data into regularly updated datasets. dlt empowers them to create highly scalable, easy to maintain, straightforward to deploy data pipelines without having to wait for help from a data engineer. When organizations eventually bring in data engineers to help with data loading, these engineers build on their work and evolve dlt pipelines.

We are dedicated to keeping dlt an open source project surrounded by a vibrant, engaged community. To make this sustainable, dltHub stewards dlt while also offering additional software and services that generate revenue (similar to what GitHub does with Git).

Why does dltHub exist?

We believe in a world where data loading becomes a commodity. A world where hundreds of thousands of pipelines will be created, shared, and deployed. A world where data sets, reports, and analytics will be written and shared publicly and privately.

To achieve our mission to make this next generation of Python users autonomous when they create and use data in their organizations, we need to address the requirements of both the Python practitioner and the data engineer with a minimal Python library. We also need dltHub to become the GitHub for data pipelines, facilitating and supporting the ecosystem of pipeline creators and maintainers as well as the other data folks who consume and analyze the data loaded.

There are lots of ETL/ELT tools available (300+!). Yet, as we engaged with Python practioners over the last one and half years, we found few Python practitioners that use traditional data ingestion tools. Only a handful have even heard of them. Very simplified, there’s two approaches in traditional data ingestion tools and neither works for this new generation: 1) SaaS solutions that handle the entire data loading process and 2) object-oriented frameworks for software engineers.

SaaS solutions do not give Python practitioners enough credit, while frameworks expect too much of them. In other words, there's no “Jupyter Notebook, pandas, NumPy, etc. for data loading” that meets users needs. As millions of Python practioners are now entering organizations every year, we think this should exist.

This demo works on codespaces. Codespaces is a development environment available for free to anyone with a Github account. You'll be asked to fork the demo repository and from there the README guides you with further steps.
The demo uses the Continue VSCode extension.

Off to codespaces!

DHelp

Ask a question

Welcome to "Codex Central", your next-gen help center, driven by OpenAI's GPT-4 model. It's more than just a forum or a FAQ hub – it's a dynamic knowledge base where coders can find AI-assisted solutions to their pressing problems. With GPT-4's powerful comprehension and predictive abilities, Codex Central provides instantaneous issue resolution, insightful debugging, and personalized guidance. Get your code running smoothly with the unparalleled support at Codex Central - coding help reimagined with AI prowess.