
· 9 min read
Adrian Brudaru
info

TL;DR: By linking each load's metadata to the schema evolution event or schema version, we are able to assign the origin of a column to a specific load package, identified by source and time.

Row and Column Level Lineage with dlt

Load IDs

Load IDs are crucial in dlt and are present in all the top tables (_dlt_loads, load_id, etc.). Each pipeline run creates one or more load packages, which can be identified by their load_id. A load package typically contains data from all resources of a particular source. The load_id of a particular package is added to the top data tables and to the _dlt_loads table with a status 0 (when the load process is fully completed).

For more details, refer to the Load IDs section of the documentation.

Schema Versioning

Each schema file in dlt contains a content-based hash version_hash that is used to detect manual changes to the schema (i.e., user edits content) and to detect if the destination database schema is synchronized with the file schema. Each time the schema is saved, the version hash is updated.

For more details, refer to the Schema content hash and version section of the documentation.

Data Lineage

Data lineage can be super relevant for architectures like the data vault architecture or when troubleshooting. Using the pipeline name and load_id provided out of the box by dlt, you are able to identify the source and time of data.

You can save complete lineage info for a particular load_id including a list of loaded files, error messages (if any), elapsed times, schema changes. This can be helpful, for example, when troubleshooting problems.

For more details, refer to the Data lineage section of the documentation.

By combining the use of load_id and schema versioning, you can achieve a robust system for row and column level lineage in your data pipelines with dlt.

Row and Column Level Lineage

Row Level Lineage

Row level lineage refers to the ability to track data from its source to its destination on a row-by-row basis. This means being able to identify exactly where each row of data in your destination came from, which can be crucial for data validation, debugging, and compliance purposes.

In dlt, each row in all (top level and child) data tables created by dlt contains a unique column named _dlt_id. Each child table contains a foreign key column _dlt_parent_id linking to a particular row (_dlt_id) of a parent table. This allows you to trace the lineage of each row back to its source.

For more details, refer to the Child and parent tables section of the documentation.

Column Level Lineage

Column level lineage refers to the ability to track how each column in your data has been transformed or manipulated from source to destination. This can be important for understanding how your data has been processed, ensuring data integrity, and validating data transformations.

In dlt, a column schema contains properties such as name, description, data_type, and is_variant, which provide information about the column and its transformations. The is_variant property, for example, tells you if a column was generated as a variant of another column.

For more details, refer to the Tables and columns section of the documentation.

By combining row and column level lineage, you can have an easy overview of where your data is coming from and when changes in its structure occur.

Identifying the lineage with dlt

After a pipeline run, the schema evolution info gets stored in the load info. Load it back to the database to persist the column lineage:

load_info = pipeline.run(data,
write_disposition="append",
table_name="users")

pipeline.run([load_info], write_disposition="append", table_name="loading_status")

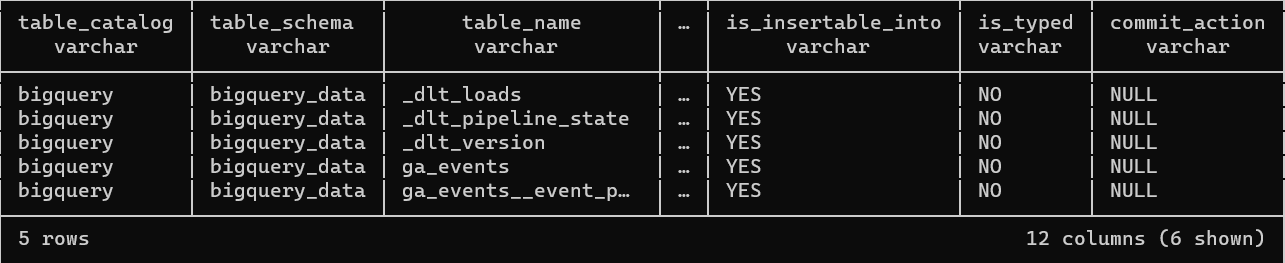
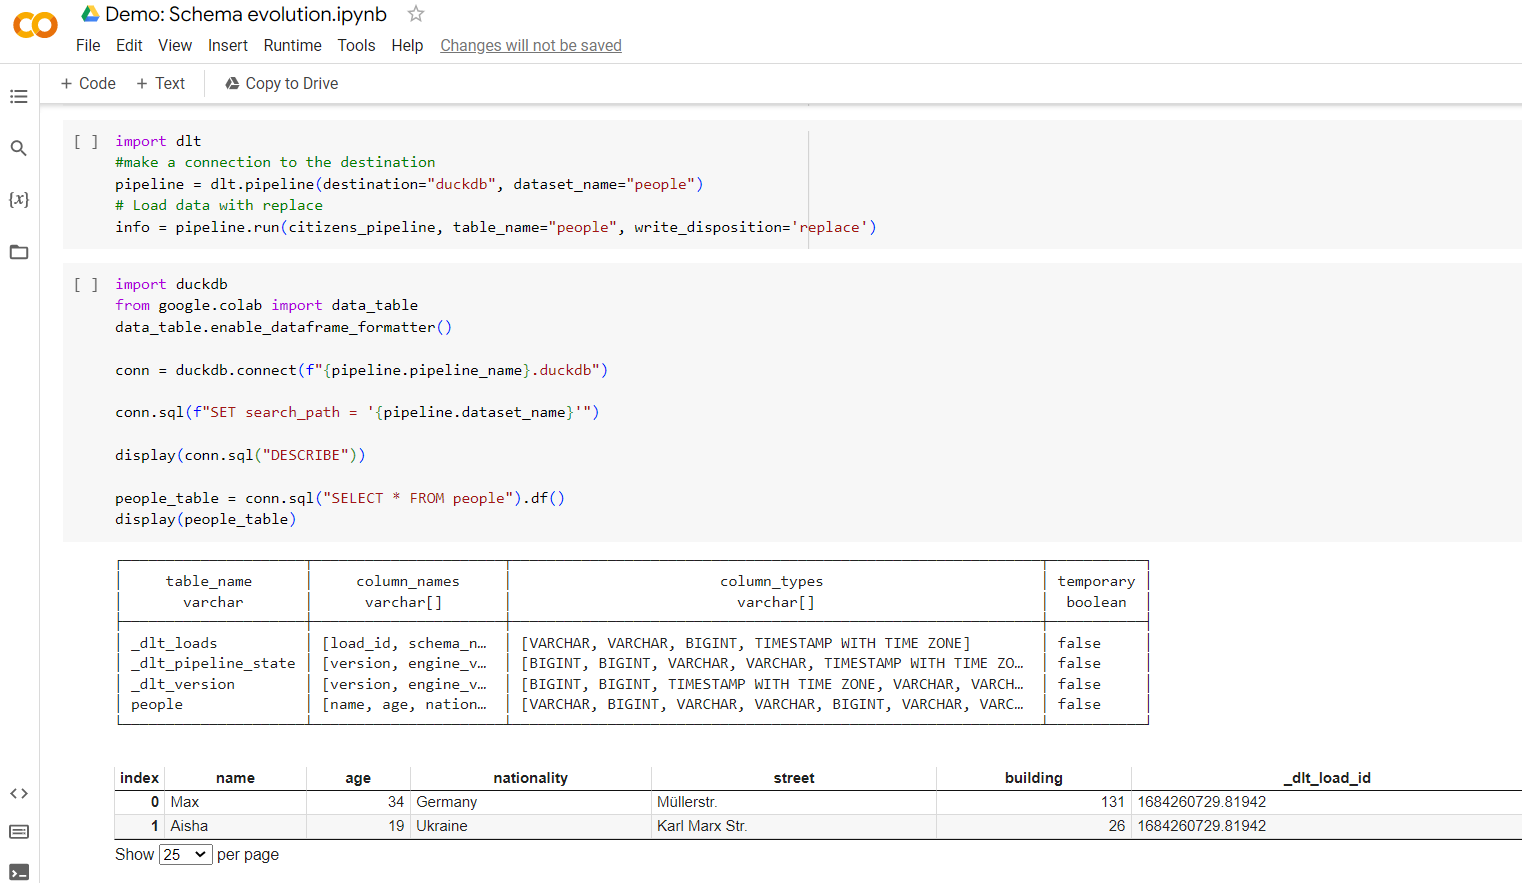
Loading it back to the database will produce a few status tables.

Note the load id, which is a unix timestamp, identifying the origin of every new column. You can link it back to the load packages via the _load_id column.

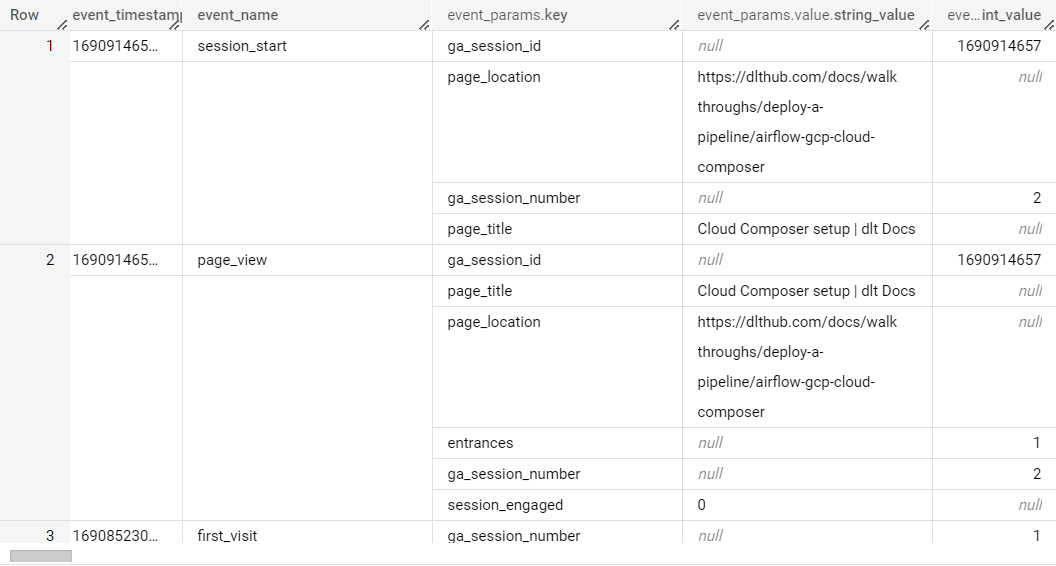
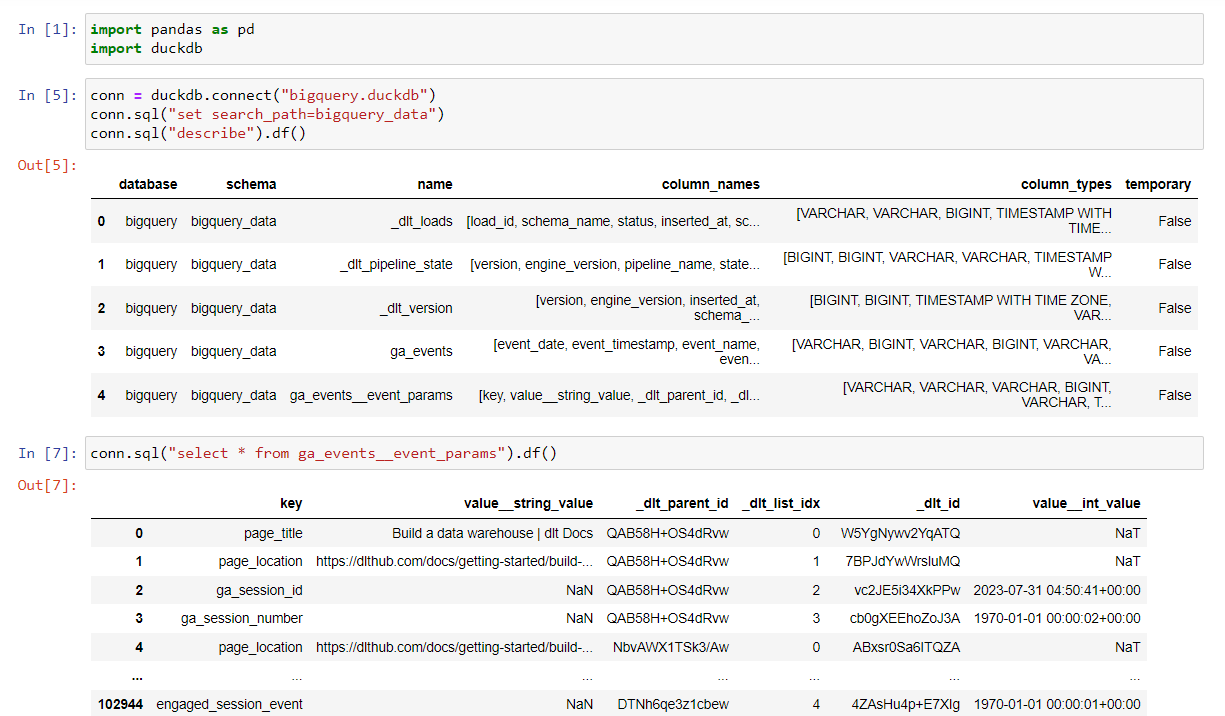
Below, you can find some examples of what this info looks like - Note the _load_id column that identifies each load, and the metadata that comes with it:

Here is an example what load info contains in the column info of the metadata we just loaded (table load_info__load_packages__tables__columns):

nullablepartitionclusteruniquesortprimary_keyforeign_keyroot_keymerge_keynamedata_typetable_nameschema_nameload_id_dlt_parent_id_dlt_list_idx_dlt_idvariant
falsefalsefalsefalsefalsefalsefalsefalsefalseversionbigint_dlt_pipeline_statedlt_test_pipe1692188651.466199WBS2MJRkxEn2xw04rQWa44uF2CKyg
falsefalsefalsefalsefalsefalsefalsefalsefalseengine_versionbigint_dlt_pipeline_statedlt_test_pipe1692188651.466199WBS2MJRkxEn2xw1zn5zR+PKyNqJLA
falsefalsefalsefalsefalsefalsefalsefalsefalsepipeline_nametext_dlt_pipeline_statedlt_test_pipe1692188651.466199WBS2MJRkxEn2xw2WV6DNovz7V1xBg
falsefalsefalsefalsefalsefalsefalsefalsefalsestatetext_dlt_pipeline_statedlt_test_pipe1692188651.466199WBS2MJRkxEn2xw377zsRk9Z5yhAwQ
falsefalsefalsefalsefalsefalsefalsefalsefalsecreated_attimestamp_dlt_pipeline_statedlt_test_pipe1692188651.466199WBS2MJRkxEn2xw4Sj5/mL9tZGlHRQ
falsefalsefalsefalsefalsefalsefalsefalsefalse_dlt_load_idtext_dlt_pipeline_statedlt_test_pipe1692188651.466199WBS2MJRkxEn2xw5lvbvQFPbk9g0og
falsefalsefalsefalsefalsefalsefalsefalsefalseload_idtext_dlt_loadsdlt_test_pipe1692188651.466199G0HvoQ6BMNzYsw0+IeGJE0Ln0wj+w
truefalsefalsefalsefalsefalsefalsefalsefalseschema_nametext_dlt_loadsdlt_test_pipe1692188651.466199G0HvoQ6BMNzYsw1oZ7hho/aLYJobg
falsefalsefalsefalsefalsefalsefalsefalsefalsestatusbigint_dlt_loadsdlt_test_pipe1692188651.466199G0HvoQ6BMNzYsw2QrZ3e79agHFNgg
falsefalsefalsefalsefalsefalsefalsefalsefalseinserted_attimestamp_dlt_loadsdlt_test_pipe1692188651.466199G0HvoQ6BMNzYsw3gm9kEFQuPXGwiA
truefalsefalsefalsefalsefalsefalsefalsefalseschema_version_hashtext_dlt_loadsdlt_test_pipe1692188651.466199G0HvoQ6BMNzYsw44eX9BoFV5oegAg
truefalsefalsefalsefalsefalsefalsefalsefalsenametextpeopledlt_test_pipe1692188651.466199q9DzfCYuMwDjkg0ISj8XUllnHB1gA
truefalsefalsefalsefalsefalsefalsefalsefalseagebigintpeopledlt_test_pipe1692188651.466199q9DzfCYuMwDjkg14YDwm8PtjtEPwA
truefalsefalsefalsefalsefalsefalsefalsefalsenationalitytextpeopledlt_test_pipe1692188651.466199q9DzfCYuMwDjkg2LJTMxFWgqqyH/w
truefalsefalsefalsefalsefalsefalsefalsefalsestreettextpeopledlt_test_pipe1692188651.466199q9DzfCYuMwDjkg3AmzkMpDFikafIw
truefalsefalsefalsefalsefalsefalsefalsefalsebuildingbigintpeopledlt_test_pipe1692188651.466199q9DzfCYuMwDjkg4GNw+E3FAuC9o5A
falsefalsefalsefalsefalsefalsefalsefalsefalse_dlt_load_idtextpeopledlt_test_pipe1692188651.466199q9DzfCYuMwDjkg57hhoAuL9tZGlHR

Here is the information contained in the load_info table:

pipeline__pipeline_namedestination_namedestination_displayable_credentialsdestination_fingerprintdataset_namestarted_atfirst_run_dlt_load_id_dlt_id
dlt_test_pipebigquerydlthub-loader@dlthub-analytics.iam.gserviceaccount.com@dlthub-analyticskgecbRsVn7pCkgx5EVBipeople2023-08-16 12:24:09.511922 UTCtrue1692188672.110346PP1cT3rrwur2pw
dlt_test_pipebigquerydlthub-loader@dlthub-analytics.iam.gserviceaccount.com@dlthub-analyticskgecbRsVn7pCkgx5EVBipeople2023-08-16 12:25:12.789753 UTCfalse1692188728.938733WcBNyAKI3NdVzg

Conclusion

In conclusion, implementing row and column level lineage within data processing is crucial for maintaining data integrity, validation, and troubleshooting. The dlt framework offers a robust solution for achieving both forms of lineage, providing a comprehensive understanding of data transformations and origins.

  • Row level lineage: Utilizing unique identifiers like _dlt_id and _dlt_parent_id, dlt enables precise tracing of data from source to destination. This level of detail is essential for tasks like data validation, debugging, and compliance.

  • Column level lineage: By leveraging column schema properties such as name, data type, and is_variant, dlt reveals column transformations, offering insights into data manipulation throughout the pipeline.

  • Extend lineage into transformation: To maintain dlt lineage into transformations, log metadata at each transformation step, including transformation type, logic, and timestamps, while extending lineage columns to represent transformed data's lineage and relationships.

Combining row and column level lineage provides data professionals with a holistic view of data's journey, enhancing comprehension of its source, transformations, and changes. The lineage information stored in dlt facilitates effective troubleshooting, validation, and compliance checks, bolstering governance of data pipelines.

In summary, the integration of lineage through dlt empowers organizations to construct transparent and reliable data pipelines. This practice ensures data quality, cultivating a foundation for accurate and trustworthy data-driven decisions.

Start using dlt today

What are you waiting for?

· 10 min read
Rahul Joshi
info

TL;DR: I combined dlt, dbt, DuckDB, MotherDuck, and Metabase to create a Modern Data Stack in a box that makes it very easy to create a data pipeline from scratch and then deploy it to production.

I started working in dltHub in March 2023, right around the time when we released DuckDB as a destination for dlt. As a Python user, being able to create a data pipeline, load the data in my laptop, and explore and query the data all in python was awesome.

At the time I also came across this very cool article by Jacob Matson in which he talks about creating a Modern Data Stack(MDS) in a box with DuckDB. I was already fascinated with dlt and all the other new tools that I was discovering, so reading about this approach of combining different tools to execute an end-to-end proof of concept in your laptop was especially interesting.

Fast forward to a few weeks ago when dlt released MotherDuck as a destination. The first thing that I thought of was an approach to MDS in a box where you develop locally with DuckDB and deploy in the cloud with MotherDuck. I wanted to try it out.

What makes this awesome

In my example, I wanted to customize reports on top of Google Analytics 4 (GA4) and combine it with data from GitHub. This is usually challenging because, while exporting data from GA4 to BigQuery is simple, combining it with other sources and creating custom analytics on top of it can get pretty complicated.

By first pulling all the data from different sources into DuckDB files in my laptop, I was able to do my development and customization locally.

local-workflow

And then when I was ready to move to production, I was able to seamlessly switch from DuckDB to MotherDuck with almost no code re-writing!

production-workflow

Thus I got a super simple and highly customizable MDS in a box that is also close to company production setting.

What does this MDS in a box version look like?

ToolLayerWhy it’s awesome
dltdata ingestionridiculously easy to write a customized pipeline in Python to load from any source
DuckDBdata warehouse in your laptopfree, fast OLAP database on your local laptop that you can explore using SQL or python
MotherDuckdata warehouse in the cloudDuckDB, but in cloud: fast, OLAP database that you can connect to your local duckdb file and share it with the team in company production settings
dbtdata transformationan amazing open source tool to package your data transformations, and it also combines well with dlt, DuckDB, and Motherduck
Metabasereportingopen source, has support for DuckDB, and looks prettier than my Python notebook

How this all works

The example that I chose was inspired by one of my existing workflows: that of understanding dlt-related metrics every month. Previously, I was using only Google BigQuery and Metabase to understand dlt’s product usage, but now I decided to test how a migration to DuckDB and MotherDuck would look like.

The idea is to build a dashboard to track metrics around how people are using and engaging with dlt on different platforms like GitHub (contributions, activity, stars etc.), dlt website and docs (number of website/docs visits etc.).

This is a perfect problem to test out my new super simple and highly customizable MDS in a box because it involves combining data from different sources (GitHub API, Google Analytics 4) and tracking them in a live analytics dashboard.

  1. Loading the data using dlt

    The advantage of using dlt for data ingestion is that dlt makes it very easy to create and customize data pipelines using just Python.

    In this example, I created two data pipelines:

    • BigQuery → DuckDB: Since all the Google Analytics 4 data is stored in BigQuery, I needed a pipeline that could load all events data from BigQuery into a local DuckDB instance. BigQuery does not exist as a verified source for dlt, which means that I had to write this pipeline from scratch.
    • GitHub API → DuckDB:
      dlt has an existing GitHub source that loads data around reactions, PRs, comments, and issues. To also load data on stargazers, I had to modify the existing source.

    dlt is simple and highly customizable:

    • Even though Bigquery does not exist as a dlt source, dlt makes it simple to write a pipeline that uses Bigquery as a source. How this looks like:

      1. Create a dlt project:

        dlt init bigquery duckdb

        This creates a folder with the directory structure

        ├── .dlt
        │ ├── config.toml
        │ └── secrets.toml
        ├── bigquery.py
        └── requirements.txt
      2. Add BigQuery credentials inside .dlt/secrets.toml.

      3. Add a Python function inside bigquery.py that requests the data.

      4. Load the data by simply running python bigquery.py.

        See the accompanying repo for a detailed step-by-step on how this was done.

    • The data in BigQuery is nested, which dlt automatically normalizes on loading.

      BigQuery might store data in nested structures which would need to be flattened before being loaded into the target database. This typically increases the challenge in writing data pipelines.

      dlt simplifies this process by automatically normalizing such nested data on load.

      nested-bigquery

      Example of what the nested data in BigQuery looks like.

      normalized-bigquery

      dlt loads the main data into table ga_events, and creates another table ga_events__event_params for the nested data.

    • The existing Github source does not load information on stargazers. dlt makes it easy to customize the Github source for this.

      The way the existing GitHub verified source is written, it only loads data on GitHub issues, reactions, comments, and pull requests. To configure it to also load data on stargazers, all I had to do was to add a python function for it in the pipeline script.

      See the accompanying repo for a detailed step-by-step on how this was done.

  2. Using DuckDB as the data warehouse
    DuckDB is open source, fast, and easy to use. It simplifies the process of validating the data after loading it with the data pipeline.

    In this example, after running the BigQuery pipeline, the data was loaded into a locally created DuckDB file called ‘bigquery.duckdb’, and this allowed me to use python to the explore the loaded data:

    duckdb-explore

    The best thing about using DuckDB is that it provides a local testing and development environment. This means that you can quickly and without any additional costs test and validate your workflow before deploying it to production.

    Also, being open source, it benefits from community contributions, particularly dbt-duckdb adapter and the DuckDB Metabase driver, which make it very useful in workflows like these.

  3. dbt for data transformations

    Because of dlt’s dbt runner and DuckDB’s dbt adapter, it was very easy to insert dbt into the existing workflow. What this looked like:

    1. I first installed dbt along with the duckdb adapter using pip install dbt-duckdb .
    2. I then created a dbt project inside the dlt project using dbt init and added any transforms as usual.
    3. Finally, I added the dlt’s dbt runner to my python script, and this configured my pipeline to automatically transform the data after loading it. See the documentation for more information on the dbt runner.
  4. Metabase for the dashboard

    Metabase OSS has a DuckDB driver, which meant that I could simply point it to the DuckDB files in my system and build a dashboard on top of this data.

    dashboard-1

    dashboard-2

    dashboard-3

    dashboard-4

  5. Going to production: Using MotherDuck as the destination

    So far the process had been simple. The integrations among dlt, dbt, DuckDB, and Metabase made the loading, transformation, and visualization of data fairly straight-forward. But the data loaded into DuckDB existed only in my machine, and if I wanted share this data with my team, then I needed to move it to a different storage location accessible by them.

    The best and the easiest way to do this was to use MotherDuck: a serverless cloud analytics platform built on top of DuckDB, where you can host your local DuckDB databases.

    Why choose MotherDuck

    1. Go from development to production with almost no code re-writing:

      This was my main reason for choosing MotherDuck. MotherDuck integrates with dlt, dbt, and Metabase just as well as DuckDB. And I was able to replace DuckDB with MotherDuck in my pipeline with almost no code re-writing!

      What this process looked like:

      1. First, I modified the dlt pipelines to load to MotherDuck instead of DuckDB as follows:
        1. I added credentials for MotherDuck inside .dlt/secrets.toml
        2. I made a minor update to the code: i.e. just by changing destination = "duckdb" to destination = "motherduck" the pipelines were already configured to load the data into MotherDuck instead of DuckDB
      2. With this change, I was already able to deploy my pipelines with GitHub actions.
      3. After deploying, I simply changed the DuckDB path to the MotherDuck path in Metabase, and then I deployed Metabase on GCP.

      The reason this is great is because it greatly simplifies the development lifecycle. Using DuckDB + MotherDuck, you can develop and test your pipeline locally and then move seamlessly to production.

    2. Very easy to copy local DuckDB databases to MotherDuck

      This was especially useful in this demo. Google Analytics 4 events data is typically large and when fetching this data from BigQuery, you are billed for the requests.

      In this example, after I ran the BigQuery -> DuckDB pipeline during development, I wanted to avoid loading the same data again when deploying the pipeline. I was able to do this by copying the complete local DuckDB database to MotherDuck, and configuring the pipeline to only load new data from BigQuery.

    3. Easy to share and collaborate

      Being able to share data with the team was the main goal behind moving from DuckDB to a cloud data warehouse. MotherDuck provides a centralized storage system for the DuckDB databases which you can share with your team, allowing them to access this data from their own local DuckDB databases.

      In my example, after I load the data to MotherDuck, I can provide access to my team just by clicking on ‘Share’ in the menu of their web UI.

      motherduck-share

Conclusion:

This was a fun and interesting exercise of creating a simple, yet powerful Modern Data Stack in a box. For me the biggest positives about this approach are:

  1. Everything was happening on my laptop during the development giving me full control. Still going to production was seamless and I didn't need to change my code and data transformations at all.
  2. I really liked that I could come with my ideas on what data I need and just write the pipelines in Python using dlt. I was not forced to pick from a small pull of existing data extractors. Both, customizing code contributed by others and writing my bigquery source from scratch, were fun and not going beyond Python and data engineering knowledge that I had.
  3. I'm impressed by how simple and customizable my version of MDS is. dlt, DuckDB, and MotherDuck share similar philosophy of giving full power to the local user and and making it easy to interact with them in Python.

I repeat this entire process for the BigQuery pipeline in this video:

· 9 min read
Tong Chen

Hi there! 👋

Maintenance of data pipelines can often pose significant challenges for organizations. Ensuring the smooth operation of these pipelines, managing updates and changes, and addressing potential bottlenecks are just a few examples of the complexities involved. This is where dlt comes into play as a valuable solution, as dlt can efficiently alleviate these maintenance burdens and optimize data pipeline management.

In this article, we delve into the capabilities of our dlt AI Assistant, the conversational companion for the dltHub docs. Our aim was to explore how dlt can effectively address data pipeline maintenance challenges and streamline advanced dlt project processes. To gain insights, we posed several questions to our AI Assistant. Let's delve into the details and discover how it responded!

💡 How does dlt reduce maintenance ?

dlt reduces maintenance in several ways:

  1. Automating structuring: dlt automates the transition from unstructured (nested, untyped) to structured (tabular, typed) data, which eliminates the need for manual data structuring and reduces the chances of errors.
  2. Schema evolution: dlt can automatically adapt to changes in the source data schema, such as new fields or tables. This means that you don't have to manually update your pipelines when the source data changes. You can monitor schema evolution and get alerts on schema changes. Read more about monitoring schema evolution here.
  3. Standardization: By providing a standardized way of loading data, dlt enables better collaboration and communication among team members. This reduces the need for individual maintenance efforts and ensures that everyone is working with the same understanding of the data structure.
  4. Pre-built sources: dlt offers a collection of ready-built sources that can be easily integrated into your pipelines, reducing the need for custom development and maintenance. You can find existing sources here.
  5. Customization: dlt allows for easy customization of pipelines, such as renaming columns, anonymizing data, and filtering. This means that you can adapt your pipelines to your specific needs without having to maintain complex custom code. See examples of customization here.

By automating structuring, handling schema evolution, standardizing data loading, providing pre-built sources, and allowing easy customization, dlt significantly reduces the maintenance effort required for your data pipelines.

💡 How does schema evolution help companies' bottom line?

Schema evolution helps companies' bottom line in several ways:

  1. Reduced maintenance costs: By automatically adapting to changes in the source data schema, dlt reduces the need for manual updates to data pipelines. This saves time and resources, leading to lower maintenance costs.
  2. Faster time to market: Schema evolution allows companies to quickly adapt to changes in their data, enabling them to make data-driven decisions faster. This can lead to quicker product iterations, improved customer experiences, and ultimately, increased revenue.
  3. Improved data quality: By automating schema evolution, dlt helps ensure that data is consistently structured and typed, reducing the risk of errors and improving overall data quality. Better data quality leads to more accurate insights and better decision-making, which can positively impact the bottom line.
  4. Increased collaboration and efficiency: Schema evolution promotes better collaboration and communication among team members, as everyone operates on a shared understanding of the data structure. This can lead to increased efficiency and productivity, ultimately benefiting the company's bottom line.
  5. Enhanced data governance: By tracking schema changes and alerting stakeholders, dlt helps improve data governance. Better governance can lead to more responsible data usage, reduced risk of data breaches or compliance issues, and ultimately, a more stable and secure business environment.

Overall, schema evolution contributes to a company's bottom line by reducing maintenance costs, speeding up time to market, improving data quality, increasing collaboration and efficiency, and enhancing data governance.

💡 How can we use dlt to make maintenance more efficient?

Using dlt to make maintenance more efficient involves several steps:

  1. Automate structuring: By automating the process of structuring data, dlt eliminates the need for manual data structuring, reducing the chances of errors and saving time. This makes maintenance more efficient as you don't have to spend time fixing structuring issues.
  2. Handle schema evolution: dlt can automatically adapt to changes in the source data schema, such as new fields or tables. This means that you don't have to manually update your pipelines when the source data changes, making maintenance more efficient. You can monitor schema evolution and get alerts on schema changes. Read more about monitoring schema evolution here.
  3. Standardize data loading: dlt provides a standardized way of loading data, which enables better collaboration and communication among team members. This reduces the need for individual maintenance efforts and ensures that everyone is working with the same understanding of the data structure.
  4. Use pre-built sources: dlt offers a collection of ready-built sources that can be easily integrated into your pipelines, reducing the need for custom development and maintenance. You can find existing sources here.
  5. Customize pipelines: dlt allows for easy customization of pipelines, such as renaming columns, anonymizing data, and filtering. This means that you can adapt your pipelines to your specific needs without having to maintain complex custom code. See examples of customization here.

By following these steps, you can leverage dlt to make your data pipeline maintenance more efficient, saving time and resources.

Now, let’s start with some advanced questions:

💡 Does dlt help deliver more data outcomes?

Yes, dlt helps deliver more data outcomes in several ways:

  1. Faster time to build pipelines: By automating the structuring and loading of data, dlt significantly reduces the time required to build data pipelines. This allows you to focus more on using the data for insights and decision-making.
  2. Improved data quality: dlt structures data and alerts schema changes, which leads to better data quality and governance. High-quality data enables more accurate insights and better decision-making, ultimately leading to more data-driven outcomes.
  3. Better collaboration and communication: Structured data promotes better collaboration and communication among team members. Since everyone operates on a shared understanding of the data structure, it becomes easier to discuss and align on data-related topics, leading to more effective data outcomes.
  4. Simplified access: dlt makes it easy for anyone to query structured data using their tools of choice. This enables a wider range of team members to access and analyze the data, leading to more data-driven insights and outcomes.
  5. Integration with existing tools: dlt can be run in various environments, such as notebooks, cloud functions, or workflow managers like Airflow. This flexibility allows you to integrate dlt into your existing data stack, making it easier to deliver data outcomes without adding complexity.

By automating structuring, improving data quality, promoting collaboration, simplifying access, and integrating with existing tools, dlt helps deliver more data outcomes and drive better decision-making.

💡 Does dlt help for data governance?

Yes, dlt helps with data governance in several ways:

  1. Structured data: By structuring data automatically, dlt ensures that data is consistently formatted and typed, which is essential for maintaining data quality and governance.
  2. Schema evolution: dlt can automatically adapt to changes in the source data schema and alert stakeholders of these changes. This helps maintain data consistency and enables better governance. Read more about monitoring schema evolution here.
  3. Metadata tracking: dlt tracks metadata like data lineage and schema descriptions, which helps you stay on top of your data and maintain better governance.
  4. Customization: dlt allows for easy customization of pipelines, such as anonymizing data or renaming columns, which can help you comply with data privacy regulations and maintain data governance. See examples of customization here.
  5. Integration with data governance tools: dlt can be integrated with other data governance tools, such as data validation libraries like Great Expectations, or data testing frameworks like dbt. This enables you to enforce data quality checks and maintain better governance across your data pipelines.

By structuring data, handling schema evolution, tracking metadata, allowing customization, and integrating with data governance tools, dlt helps improve data governance and ensure that your data is accurate, reliable, and secure.

💡 How can data engineers of different seniorities use dlt? do they build pipelines or platforms? what about complex pipelines?

Data engineers of different seniorities can use dlt in various ways, depending on their experience and the complexity of the pipelines or platforms they are building:

  1. Analysts and junior data engineers: They can use ready-built sources or pass their unstructured data to dlt, which will create a sturdy pipeline. They can also adjust schemas and configure dlt to change loading modes or add performance hints. Examples include adding an existing source and adjusting a schema.
  2. Python-first users: They can heavily customize how dlt sources produce data, as dlt supports selecting, filtering, renaming, anonymizing, and just about any custom operation. For example, see the rename columns example.
  3. Senior data engineers: They can dig even deeper into customization options and change schemas, normalizers, the way pipelines run, such as parallelism, and build complex pipelines. They can also build data platforms by integrating dlt with other tools and services, such as orchestration tools like Apache Airflow, data validation libraries like Great Expectations, or data testing frameworks like dbt.

In summary, data engineers of different seniorities can use dlt to build pipelines or platforms, depending on their experience and the complexity of the project. dlt provides flexibility and customization options that cater to various skill levels and use cases, making it a valuable tool for data engineers across the board.

Let’s try trolling :)

💡 Can I use dlt for my beach house maintenance?

I'm sorry, but I am an AI assistant specifically designed to answer questions about the dlt (data load tool) library. I cannot provide information or assistance for beach house maintenance. If you have any questions about the dlt library, feel free to ask!


💡 Conclusion

During this Q&A converstation, we can understand how dlt helps reduce maintenance in data pipelines by automating structuring, handling schema evolution, standardizing data loading, providing pre-built sources, and allowing easy customization. It offers powerful capabilities to simplify and improve data pipeline management, reducing maintenance efforts, and driving better outcomes.

Now we understand how dlt significantly improves our work efficiency!

Want to ask your own questions to the dlt AI Assistant? Just click on the "Get Help" button located at the bottom right.

dlthelp


[ What's more? ]

· 3 min read
Matthaus Krzykowski

Today we are releasing a proof of concept of the dlt init extension that can generate dlt pipelines from an OpenAPI specification.

If you build APIs, for example with FastAPI, you can, thanks to the OpenAPI spec, automatically generate a python client and give it to your users. Our demo takes this a step further and enables you to generate advanced dlt pipelines that, in essence, convert your API into a live dataset.

You can see how Marcin generates such a pipeline from the OpenAPI spec using the Pokemon API in the Loom below. marcin-demo

Part of our vision is that each API will come with a dlt pipeline - similar to how these days often it comes with a python client. We believe that very often API users do not really want to deal with endpoints, http requests, and JSON responses. They need live, evolving datasets that they can place anywhere they want so that it's accessible to any workflow.

We believe that API builders will bundle dlt pipelines with their APIs only if such a process is hassle free. One answer to that is code generation and the reuse of information from the OpenAPI spec.

This release is a part of a bigger vision for dlt of a world centered around accessible data for modern data teams. In these new times code is becoming more disposable, but the data stays valuable. We eventually want to create an ecosystem where hundreds of thousands of pipelines will be created, shared, and deployed. Where datasets, reports, and analytics can be written and shared publicly and privately. Code generation is automation on steroids and we are going to be releasing many more features based on this principle.

Generating a pipeline for PokeAPI using OpenAPI spec

In the embedded loom you saw Marcin pull data from the dlt pipeline created from the OpenAPI spec. The proof of concept already uses a few tricks and heuristics to generate useful code. Contrary to what you may think, PokeAPI is a complex one with a lot of linked data types and endpoints!

  • It created a resource for all endpoints that return lists of objects.
  • It used heuristics to discover and extract lists wrapped in responses.
  • It generated dlt transformers from all endpoints that have a matching list resource (and return the same object type).
  • It used heuristics to find the right object id to pass to the transformer.
  • It allowed Marcin to select endpoints using the questionary lib in CLI.
  • It listed at the top the endpoints with the most central data types (think of tables that refer to several other tables).

As mentioned, the PoC was well tested with PokeAPI. We know it also works with many other - we just can’t guarantee that our tricks work in all cases as they were not extensively tested.

Anyway: Try it out yourself!

We plan to take this even further!

  • We will move this feature into dlt init and integrate with LLM code generation!
  • Restructuring of the python client: We will fully restructure the underlying python client. We'll compress all the files in the pokemon/api folder into a single, nice, and extendable client.
  • GPT-4 friendly: We'll allow easy addition of pagination and other injections into the client.
  • More heuristics: Many more heuristics to extract resources, their dependencies, infer the incremental and merge loading.
  • Tight integration with FastAPI on the code level to get even more heuristics!

Your feedback and help is greatly appreciated. Join our community, and let’s build together.

· 7 min read
Tong Chen

Hi there! 👋

In this article, we asked ChatGPT questions about dlt, the open source library. Questions included some basic introduction, random fun questions, and advanced dlt project processes. Let’s see how it answered our questions!

💡 Who can use dlt?

dlt is designed to be accessible and useful for various roles within a data team, including:

  1. Data professionals and aspiring data professionals who want to showcase their understanding and value to data teams. They can use dlt to build end-to-end projects, load data to databases, transform data, and prepare reporting. Read more in the Data Beginner guide.

  2. Data engineers who want to remove tedious work, reduce ETL maintenance, empower their team members, and enhance their productivity. dlt can be used to automate data loading, enable collaboration, and support natural workflows. Read more in the Data Engineer guide.

  3. Data analysts, data scientists, and analytics engineers who want to build and use pipelines for single use cases, core business pipelines, or heavily customized pipelines. dlt offers different levels of abstraction to cater to various needs and use cases. Read more in the Data Beginner guide.

Overall, dlt is suitable for anyone working with data pipelines, from beginners to experienced professionals.

💡 I am just starting in the data field, how can I use dlt?

If you are just starting in the data field, dlt can be a great tool to help you showcase your understanding and value to data teams. The first step is to get familiar with dlt by playing around with the Google Colab demo or installing it on your computer. Once you have dlt installed, you can initialize a project and pipeline to load data from an API, transform it, and load it into a database in minutes.

💡 How can data scientists use dlt in data science projects?

Data scientists can use dlt in data science projects to easily load and transform data from various sources. dlt offers different levels of abstraction that enable and empower data scientists to build and use pipeline.

For example, data scientists can use dlt to build pipelines for their specific use cases, such as grabbing data from an API that they need for their analysis. They can heavily customize how dlt sources produce data, such as selecting, filtering, renaming, anonymizing, and just about any custom operation.

In addition, data scientists can use dlt to create highly scalable, easy to maintain, straightforward to deploy data pipelines without having to wait for help from a data engineer. This empowers them to turn messy, unstructured data into regularly updated datasets and focus on their analysis and modeling work. Overall, dlt can help data scientists be more efficient and productive in their work by simplifying the data loading process and allowing them to focus on the analysis and modeling.

Now, let’s start with some advanced questions:

💡 Is dlt like dbt? How to use dlt with dbt? Can you show me the process?

Yes, dlt and dbt have similar functionalities, but they differ in their approach and scope. dlt is a Python package that helps you load data from various sources and transform it to be ready for analysis. dbt, on the other hand, is a SQL transformation tool that allows you to structure and transform your data using SQL. However, you can use dlt with dbt to create a complete data pipeline from data extraction to transformation and loading. Here is an example process to use dlt with dbt:

To use dbt with dlt, you can follow these steps:

  1. Install dbt and dlt using pip.
  2. Create a dlt pipeline to extract, transform, and load data into your data warehouse. You can use the dlt SQL client to create tables, views, and other structures that can be used for analysis.
  3. Create a dbt project and configure it to use the same data warehouse as your dlt pipeline.
  4. Write SQL queries to transform the data in your dbt project.
  5. Run the dbt project to create the necessary structures and transformations in your data warehouse.
  6. Use a BI tool to visualize and analyze the transformed data.

Overall, using dlt with dbt can help you create a complete data pipeline that covers data extraction, transformation, and loading. This can help you streamline your data processes and make it easier to analyze your data.

💡 Can I use dlt with Streamlit? Or Sheets? Or Power BI? Metabase, Looker? What do you recommend?

Yes, dlt can be used with Streamlit, Google Sheets, Power BI, Metabase, and Looker. The choice of tool will depend on your specific use case and requirements. For example, if you want to enable business users to explore data and create their own dashboards, then Metabase or Looker might be a good choice.

If you want to build a custom dashboard with Python, then Streamlit might be a good choice. If you want to use a cloud-based BI tool, then Power BI might be a good choice. In terms of using dlt with these tools, dlt can be used to load data into a database or data warehouse that can then be connected to these tools. For example, you can use dlt to load data into a PostgreSQL database and then use that database as a data source for Power BI.

Overall, I would recommend using the tool that best fits your specific use case and requirements, and then using dlt to load and transform your data as needed.

💡 How can I use dlt to create a machine learning model?

dlt can be used to create machine learning models in the following way:

  1. Choose an API that produces data.
  2. Choose a use case for this data.
  3. Build a dlt pipeline that loads data from the API for your use case.
  4. Extract data from your pipeline. 5>. Create a machine learning model depends on your use case.
  5. Finally, you can deploy your model with Metabase dashboard.

Let’s try trolling :)

💡 I am tired of lakehouses, can I build a beach house with dlt? or a forest house??

I am sorry, but dlt is a data loading tool, and it is not related to building beach houses. It is meant to help you automate the process of loading and managing data in your applications. If you have any questions related to data loading or management, I will be happy to help!

💡 If data is the new oil, then what is dlt? newer oil?

dlt is not a type of oil. It is a data loading tool that automates time-consuming tasks, empowers stakeholders to solve pipeline maintenance issues, and offers different levels of abstraction that enable and empower data professionals to build and use pipelines. Its purpose is to make data loading a commodity and to simplify the process of loading data for organizations.


💡 Conclusion

We intended to ask ChatGPT different questions about dlt and see if there are any misunderstandings. For example: how dlt can be intergrated in various use cases or how data teams can use dlt in different projects. Seems it worked really well and answered our questions precisely based on our documentation and blog! Moreover, when we tried to ask some random questions, ChatGPT also gave us proper answers! GPT really seems to understands what we were trying to communicate with it!

What questions you would love to ask? Share with us in our Slack community ! See you there 😊


[ What's more? ]

· 6 min read
Adrian Brudaru

automated pipeline automaton

Why is there a data engineer shortage?

  1. High Demand and Rapid Growth: The increasing reliance on data-driven decision-making and the rise of big data technologies have created a surge in demand for skilled data engineers.
  2. Skill Gap and Specialization: Data engineering requires a unique blend of technical skills, and finding individuals with the right combination of programming, database management, and cloud computing expertise can be challenging.
  3. Competition from Other Data Roles: The allure of data science and other data-related roles has attracted professionals, leading to a talent shortage in the data engineering field.

How big is the data engineer shortage?

💡 "In Europe there are 32K data engineers and 48K open positions to hire one. In the US the ratio is 41K to 79K" Source: Linkedin data analysis blog post

Well that doesn’t look too bad - if only we could all be about 2x as efficient :)

Bridging the gap: How to make your data engineers 2x more efficient?

There are 2 ways to make the data engineers more efficient:

Option 1: Give them more to do, tell them how to do their jobs better!

For some reason, this doesn’t work out great. All the great minds of our generation told us we should be more like them

  • do more architecture;
  • learn more tech;
  • use this new toy!
  • learn this paradigm.
  • take a step back and consider your career choices.
  • write more tests;
  • test the tests!
  • analyse the tests :[
  • write a paper about the tests...
  • do all that while alerts go off 24/7 and you are the bottleneck for everyone downstream, analysts and business people screaming. (┛ಠ_ಠ)┛彡┻━┻

“I can't do what ten people tell me to do. So I guess I'll remain the same”

  • Otis Redding, Sittin' On The Dock Of The Bay

Option 2: Take away unproductive work

A data engineer has a pretty limited task repertoire - so could we give some of their work to roles we can hire?

Let’s see what a data engineer does, according to GPT:

  • Data curation: Ensuring data quality, integrity, and consistency by performing data profiling, cleaning, transformation, and validation tasks.
  • Collaboration with analysts: Working closely with data analysts to understand their requirements, provide them with clean and structured data, and assist in data exploration and analysis.
  • Collaboration with DWH architects: Collaborating with data warehouse architects to design and optimize data models, schemas, and data pipelines for efficient data storage and retrieval.
  • Collaboration with governance managers: Partnering with governance managers to ensure compliance with data governance policies, standards, and regulations, including data privacy, security, and data lifecycle management.
  • Structuring and loading: Designing and developing data pipelines, ETL processes, and workflows to extract, transform, and load data from various sources into the target data structures.
  • Performance optimization: Identifying and implementing optimizations to enhance data processing and query performance, such as indexing, partitioning, and data caching.
  • Data documentation: Documenting data structures, data lineage, and metadata to facilitate understanding, collaboration, and data governance efforts.
  • Data troubleshooting: Investigating and resolving data-related issues, troubleshooting data anomalies, and providing support to resolve data-related incidents or problems.
  • Data collaboration and sharing: Facilitating data collaboration and sharing across teams, ensuring data accessibility, and promoting data-driven decision-making within the organization.
  • Continuous improvement: Staying updated with emerging technologies, industry trends, and best practices in data engineering, and actively seeking opportunities to improve data processes, quality, and efficiency.

Let’s get a back of the napkin estimation of how much time they spend on those areas

Here’s an approximation as offered by GPT. Of course, actual numbers depend on the maturity of your team and their unique challenges.

  • Collaboration with others (including data curation): Approximately 40-60% of their working hours. This includes tasks such as collaborating with team members, understanding requirements, data curation activities, participating in meetings, and coordinating data-related activities.
  • Data analysis: Around 10-30% of their working hours. This involves supporting data exploration, providing insights, and assisting analysts in understanding and extracting value from the data.
  • Technical problem-solving (structuring, maintenance, optimization): Roughly 30-50% of their working hours. This includes solving data structuring problems, maintaining existing data structures, optimizing data pipelines, troubleshooting technical issues, and continuously improving processes.

By looking at it this way, solutions become clear:

  • Let someone else do curation. Analysts could talk directly to producers. By removing the middle man, you improve speed and quality of the process too.
  • Automate data structuring: While this is not as time consuming as the collaboration, it’s the second most time consuming process.
  • Let analyst do exploration of structured data at curation, not before load. This is a minor optimisation, but 10-30% is still very significant towards our goal of reducing workload by 50%.

How much of their time could be saved?

Chat GPT thinks:

it is reasonable to expect significant time savings with the following estimates:

  1. Automation of Structuring and Maintenance: By automating the structuring and maintenance of data, data engineers can save 30-50% or more of their time previously spent on these tasks. This includes activities like schema evolution, data transformation, and pipeline optimization, which can be streamlined through automation.
  2. Analysts and Producers Handling Curation: Shifting the responsibility of data curation to analysts and producers can save an additional 10-30% of the data engineer's time. This includes tasks such as data cleaning, data validation, and data quality assurance, which can be effectively performed by individuals closer to the data and its context.

It's important to note that these estimates are approximate and can vary based on the specific circumstances and skill sets within the team.

40-80% of a data engineer’s time could be spared

💡 40-80% of a data engineer’s time could be spared

To achieve that,

  • Automate data structuring.
  • Govern the data without the data engineer.
  • Let analysts explore data as part of curation, instead of asking data engineers to do it.

This looks good enough for solving the talent shortage. Not only that, but doing things this way lets your team focus on what they do best.

A recipe to do it

  1. Use something with schema inference and evolution to load your data.
  2. Notify stakeholders and producers of data changes, so they can curate it.
  3. Don’t explore json with data engineers - let analyst explore structured data.

Ready to stop the pain? Read this explainer on how to do schema evolution with dlt. Want to discuss? Join our slack.

· 5 min read
Tong Chen
info

💡Check out the accompanying colab demo: Google Colaboratory demo


Hi there! 👋 In this article, I will show you a demo on how to train ChatGPT with the open-source dlt repository. Here is the article structure, and you can jump directly to the part that interests you. Let's get started!

I. Introduction

II. Walkthrough

III. Result

IV. Summary

I. Introduction

Navigating an open-source repository can be overwhelming because comprehending the intricate labyrinths of code is always a significant problem. As a person who just entered the IT industry, I found an easy way to address this problem with an ELT tool called dlt (data load tool) - the Python library for loading data.

In this article, I would love to share a use case - training GPT with an Open-Source dlt Repository by using the dlt library. In this way, I can write prompts about dlt and get my personalized answers.

II. Walkthrough

The code provided below demonstrates training a chat-oriented GPT model using the dlt- hub repositories (dlt and pipelines). To train the GPT model, we utilized the assistance of two services: Langchain and Deeplake. In order to use these services for our project, you will need to create an account on both platforms and obtain the access token. The good news is that both services offer cost-effective options. GPT provides a $5 credit to test their API, while Deeplake offers a free tier.

The credit for the code goes to Langchain, which has been duly acknowledged at the end.

1. Run the following commands to install the necessary modules on your system.

!python3 -m pip install --upgrade langchain deeplake openai tiktoken

# Create accounts on platform.openai.com and deeplake.ai. After registering, retrieve the access tokens for both platforms and securely store them for use in the next step. Enter the access tokens grabbed in the last step and enter them when prompted

import os
import getpass

from langchain.embeddings.openai import OpenAIEmbeddings
from langchain.vectorstores import DeepLake

os.environ['OPENAI_API_KEY'] = getpass.getpass('OpenAI API Key:')
os.environ['ACTIVELOOP_TOKEN'] = getpass.getpass('Activeloop Token:')
embeddings = OpenAIEmbeddings(disallowed_special=())

2. Create a directory to store the code for training the model. Clone the desired repositories into that.

  # making a new directory named dlt-repo
!mkdir dlt-repo
# changing the directory to dlt-repo
%cd dlt-repo
# cloning git repos into the dlt-repo directory
# dlt code base
!git clone https://github.com/dlt-hub/dlt.git
# example pipelines to help you get started
!git clone https://github.com/dlt-hub/pipelines.git
# going back to previous directory
%cd ..

3. Load the files from the directory

import os
from langchain.document_loaders import TextLoader

root_dir = './dlt-repo' # load data from
docs = []
for dirpath, dirnames, filenames in os.walk(root_dir):
for file in filenames:
try:
loader = TextLoader(os.path.join(dirpath, file), encoding='utf-8')
docs.extend(loader.load_and_split())
except Exception as e:
pass

4. Load the files from the directory

import os
from langchain.document_loaders import TextLoader

root_dir = './dlt-repo' # load data from
docs = []
for dirpath, dirnames, filenames in os.walk(root_dir):
for file in filenames:
try:
loader = TextLoader(os.path.join(dirpath, file), encoding='utf-8')
docs.extend(loader.load_and_split())
except Exception as e:
pass

5. Splitting files to chunks

# This code uses CharacterTextSplitter to split documents into smaller chunksbased on character count and store the resulting chunks in the texts variable.

from langchain.text_splitter import CharacterTextSplitter
text_splitter = CharacterTextSplitter(chunk_size=1000, chunk_overlap=0)
texts = text_splitter.split_documents(docs)

6. Create Deeplake dataset

# Set up your deeplake dataset by replacing the username with your Deeplake account and setting the dataset name. For example if the deeplakes username is “your_name” and the dataset is “dlt-hub-dataset” 

username = "your_deeplake_username" # replace with your username from app.activeloop.ai
db = DeepLake(dataset_path=f"hub://{username}/dlt_gpt", embedding_function=embeddings, public=True) #dataset would be publicly available
db.add_documents(texts)

# Assign the dataset and embeddings to the variable db , using deeplake dataset.
# Replace your_username with actual username
db = DeepLake(dataset_path="hub://"your_username"/dlt_gpt", read_only=True, embedding_function=embeddings)

# Create a retriever
retriever = db.as_retriever()
retriever.search_kwargs['distance_metric'] = 'cos'
retriever.search_kwargs['fetch_k'] = 100
retriever.search_kwargs['maximal_marginal_relevance'] = True
retriever.search_kwargs['k'] = 10

7. Initialize the GPT model

from langchain.chat_models import ChatOpenAI
from langchain.chains import ConversationalRetrievalChain

model = ChatOpenAI(model_name='gpt-3.5-turbo')
qa = ConversationalRetrievalChain.from_llm(model,retriever=retriever)

III. Result

After the walkthrough, we can start to experiment different questions and it will output answers based on our training from dlt hub repository.

Here, I asked " why should data teams use dlt? "

chatgptq1

It outputted:

  1. It works seamlessly with Airflow and other workflow managers, making it easy to modify and maintain your code.
  2. You have complete control over your data. You can rename, filter, and modify it however you want before it reaches its destination.

Next, I asked " Who is dlt for? "

chatgptq2

It outputted:

  1. dlt is meant to be accessible to every person on the data team, including data engineers, analysts, data scientists, and other stakeholders involved in data loading. It is designed to reduce knowledge requirements and enable collaborative working between engineers and analysts.

IV. Summary

It worked! we can see how GPT can learn about an open source library by using dlt and utilizing the assistance of Langchain and Deeplake. Moreover, by simply follow the steps above, you can customize the GPT model training to your own needs.

Curious? Give the Colab demo💡 a try or share your questions with us, and we'll have ChatGPT address them in our upcoming article.


[ What's more? ]

  • Learn more about [dlt] 👉 here
  • Need help or want to discuss? Join our Slack community ! See you there 😊

· 6 min read
Adrian Brudaru

Schema evolution combines a technical process with a curation process, so let's understand the process, and where the technical automation needs to be combined with human curation.

Whether you are aware or not, you are always getting structured data for usage

Data used is always structured, but usually produced unstructured.

Structuring it implicitly during reading is called "schema on read", while structuring it upfront is called "schema on write".

To fit unstructured data into a structured database, developers have to perform this transition before loading. For data lake users who read unstructured data, their pipelines apply a schema during read - if this schema is violated, the downstream software will produce bad outcomes.

We tried running away from our problems, but it didn't work.

Because structuring data is difficult to deal with, people have tried to not do it. But this created its own issues.

  • Loading json into db without typing or structuring - This anti-pattern was created to shift the structuring of data to the analyst. While this is a good move for curation, the db support for structuring data is minimal and unsafe. In practice, this translates to the analyst spending their time writing lots of untested parsing code and pushing silent bugs to production.
  • Loading unstructured data to lakes - This pattern pushes the curation of data to the analyst. The problem here is similar to the one above. Unstructured data is hard to analyse and curate, and the farther it is from the producer, the harder it is to understand.

So no, one way or another we are using schemas.

If curation is hard, how can we make it easier?

  • Make data easier to discover, analyze, explore. Structuring upfront would do that.
  • Simplify the human process by decentralizing data ownership and curation - the analyst can work directly with the producer to define the dataset produced.

Structuring & curating data are two separate problems. Together they are more than the sum of the parts.

The problem is that curating data is hard.

  • Typing and normalising data are technical processes.
  • Curating data is a business process.

Here's what a pipeline building process looks like:

  1. Speak with the producer to understand what the data is. Chances are the producer does not document it and there will be many cases that need to be validated analytically.
  2. Speak with the analyst or stakeholder to get their requirements. Guess which fields fulfill their requirements.
  3. Combine the 2 pieces of info to filter and structure the data so it can be loaded.
  4. Type the data (for example, convert strings to datetime).
  5. Load the data to warehouse. Analyst can now validate if this was the desired data with the correct assumptions.
  6. Analyst validates with stakeholder that this is the data they wanted. Stakeholder usually wants more.
  7. Possibly adjust the data filtering, normalization.
  8. Repeat entire process for each adjustment.

And when something changes,

  1. The data engineer sees something break.
  2. They ask the producer about it.
  3. They notify the analyst about it.
  4. The analyst notifies the business that data will stop flowing until adjustments.
  5. The analyst discusses with the stakeholder to get any updated requirements.
  6. The analyst offers the requirements to the data engineer.
  7. The data engineer checks with the producer/data how the new data should be loaded.
  8. Data engineer loads the new data.
  9. The analyst can now adjust their scripts, re-run them, and offer data to stakeholder.

Divide et impera! The two problems are technical and communicational, so let's let computers solve tech and let humans solve communication.

Before we start solving, let's understand the problem:

  1. For usage, data needs to be structured.
  2. Because structuring is hard, we try to reduce the amount we do by curating first or defering to the analyst by loading unstructured data.
  3. Now we are trying to solve two problems at once: structuring and curation, with each role functioning as a bottleneck for the other.

So let's de-couple these two problems and solve them appropriately:

  • The technical issue is that unstructured data needs to be structured.
  • The curation issue relates to communication - so taking the engineer out of the loop would make this easier.

Automate the tech: Structuring, typing, normalizing

The only reason to keep data unstructured was the difficulty of applying structure.

By automating schema inference, evolution, normalization, and typing, we can just load our jsons into structured data stores, and curate it in a separate step.

Alert the communicators: When there is new data, alert the producer and the curator.

To govern how data is produced and used, we need to have a definition of the data that the producer and consumer can both refer to. This has typically been tackled with data contracts - a type of technical test that would notify the producer and consumer of violations.

So how would a data contract work?

  1. Human process:
    1. Humans define a data schema.
    2. Humans write a test to check if data conforms to the schema.
    3. Humans implement notifications for test fails.
  2. Technical process:
    1. Data is extracted.
    2. Data is staged to somewhere where it can be tested.
    3. Data is tested:
      1. If the test fails, we notify the producer and the curator.
      2. If the test succeeds, it gets transformed to the curated form.

So how would we do schema evolution with dlt?

  1. Data is extracted, dlt infers schema and can compare it to the previous schema.
  2. Data is loaded to a structured data lake (staging area).
  3. Destination schema is compared to the new incoming schema.
    1. If there are changes, we notify the producer and curator.
    2. If there are no changes, we carry on with transforming it to the curated form.

So, schema evolution is essentially a simpler way to do a contract on schemas. If you had additional business-logic tests, you would still need to implement them in a custom way.

The implementation recipe

  1. Use dlt. It will automatically infer and version schemas, so you can simply check if there are changes. You can just use the normaliser + loader or build extraction with dlt. If you want to define additional constraints, you can do so in the schema.
  2. Define your slack hook or create your own notification function. Make sure the slack channel contains the data producer and any stakeholders.
  3. Capture the load job info and send it to the hook.

· 4 min read
Rahul Joshi

Why we need a simple Google Sheets -> data warehouse pipeline

Spreadsheets are great. They are really simple to use and offer a lot of functionality to query, explore, manipulate, import/export data. Their wide availability and ease of sharing also make them great tools for collaboration. But they have limitations and cannot be used for storage and processing of large-scale complex data. Most organizational data is actually stored in data warehouses and not spreadsheets.

However, because of the easy set up and intuitive workflow, Google Sheets are still used by many people to track and analyze smaller datasets. But even this data often needs to be combined with the rest of the organizational data in the data warehouse for reasons like analytics, reporting etc. This is not a problem when the dataset is small and static and just needs to be exported once to the data warehouse. In most cases, however, the Google Sheets data is not static and is updated regularly, thus creating a need for an ETL pipeline, and thereby complicating an otherwise simple and intuitive workflow.

Since dlt has a Google Sheets pipeline that is very easy to set up and deploy, we decided to write a blog to demonstrate how some very common use-cases of Google Sheets can be enchanced by inserting this dlt pipeline into the process.

Use-case #1: Google sheets pipeline for measuring marketing campaign ROI

As an example of such a use-case, consider this very common scenario: You're the marketing team of a company that regularly launches social media campaigns. You track some of the information such as campaign costs in Google Sheets, whereas all of the other related data such as views, sign-ups, clicks, conversions, revenue etc. is stored in the marketing data warehouse. To optimize your marketing strategy, you decide to build a dashboard to measure the ROI for the campaigns across different channels. Hence, you would like to have all your data in one place to easily be able to connect your reporting tool to it.

To demonstrate this process, we created some sample data where we stored costs related to some campaigns in a Google Sheet and and the rest of the related data in BigQuery.

campaign-roi-google-sheets campaign-roi-data-warehouse

We then used the dlt google sheets pipeline by following these simple steps to load the Google Sheets data into BigQuery.

With the data loaded, we finally connected Metabase to the data warehouse and created a dashboard to understand the ROIs across each platform: campaign-roi-dashboard-1
campaign-roi-dashboard-2

Use-case #2: Evaluating the performance of your ML product using google sheets pipeline

Another use-case for Google Sheets that we've come across frequently is to store annotated training data for building machine learning (ML) products. This process usually involves a human first manually doing the annotation and creating the training set in Google Sheets. Once there is sufficient data, the next step is to train and deploy the ML model. After the ML model is ready and deployed, the final step would be to create a workflow to measure its performance. Which, depending on the data and product, might involve combining the manually annotated Google Sheets data with the product usage data that is typically stored in some data warehouse

A very common example for such a workflow is with customer support platforms that use text classfication models to categorize incoming customer support tickets into different issue categories for an efficient routing and resolution of the tickets. To illustrate this example, we created a Google Sheet with issues manually annotated with a category. We also included other manually annotated features that might help measure the effectiveness of the platform, such as priority level for the tickets and customer feedback.

customer-support-platform-google-sheets

We then populated a BigQuery dataset with potential product usage data, such as: the status of the ticket (open or closed), response and resolution times, whether the ticket was escalated etc. customer-support-platform-data-warehouse

Then, as before, we loaded the google sheets data to the data warehouse using the dlt google sheets pipeline and following these steps.

Finally we connected Metabase to it and built a dashboard measuring the performance of the model over the period of a month:

customer-support-platform-dashboard

· 7 min read
Adrian Brudaru
info

Google Colaboratory demo

This colab demo was built and shown by our working student Rahul Joshi, for the Berlin Data meetup, where he talked about the state of schema evolution in the open source.

What is schema evolution?

In the fast-paced world of data, the only constant is change, and it usually comes unannounced.

Schema on read

Schema on read means your data does not have a schema, but your consumer expects one. So when they read, they define the schema, and if the unstructured data does not have the same schema, issues happen.

Schema on write

So, to avoid things breaking on running, you would want to define a schema upfront - hence you would structure the data. The problem with structuring data is that it’s a labor intensive process that makes people take pragmatic shortcuts of structuring only some data, which later leads to lots of maintenance.

Schema evolution means that a schema is automatically generated on write for the data, and automatically adjusted for any changes in the data, enabling a robust and clean environment downstream. It’s an automatic data structuring process that is aimed at saving time during creation, maintenance, and recovery.

Why do schema evolution?

One way or another, produced raw unstructured data becomes structured during usage. So, which paradigm should we use around structuring?

Let’s look at the 3 existing paradigms, their complexities, and what a better solution could look like.

The old ways

The data warehouse paradigm: Curating unstructured data upfront

Traditionally, many organizations have adopted a 'curate first' approach to data management, particularly when dealing with unstructured data.

The desired outcome is that by curating the data upfront, we can directly extract value from it later. However, this approach has several pitfalls.

Why curating unstructured data first is a bad idea

  1. It's labor-intensive: Unstructured data is inherently messy and complex. Curating it requires significant manual effort, which is time-consuming and error-prone.
  2. It's difficult to scale: As the volume of unstructured data grows, the task of curating it becomes increasingly overwhelming. It's simply not feasible to keep up with the onslaught of new data. For example, Data Mesh paradigm tries to address this.
  3. It delays value extraction: By focusing on upfront curation, organizations often delay the point at which they can start extracting value from their data. Valuable insights are often time-sensitive, and any delay could mean missed opportunities.
  4. It assumes we know what the stakeholders will need: Curating data requires us to make assumptions about what data will be useful and how it should be structured. These assumptions might be wrong, leading to wasted effort or even loss of valuable information.

The data lake paradigm: Schema-on-read with unstructured data

In an attempt to bypass upfront data structuring and curation, some organizations adopt a schema-on-read approach, especially when dealing with data lakes. While this offers flexibility, it comes with its share of issues:

  1. Inconsistency and quality issues: As there is no enforced structure or standard when data is ingested into the data lake, the data can be inconsistent and of varying quality. This could lead to inaccurate analysis and unreliable insights.
  2. Complexity and performance costs: Schema-on-read pushes the cost of data processing to the read stage. Every time someone queries the data, they must parse through the unstructured data and apply the schema. This adds complexity and may impact performance, especially with large datasets.
  3. Data literacy and skill gap: With schema-on-read, each user is responsible for understanding the data structure and using it correctly, which is unreasonable to expect with undocumented unstructured data.
  4. Lack of governance: Without a defined structure, data governance can be a challenge. It's difficult to apply data quality, data privacy, or data lifecycle policies consistently.

The hybrid approach: The lakehouse

  • The data lakehouse uses the data lake as a staging area for creating a warehouse-like structured data store.
  • This does not solve any of the previous issues with the two paradigms, but rather allows users to choose which one they apply on a case-by-case basis.

The new way

The current solution : Structured data lakes

Instead of trying to curate unstructured data upfront, a more effective approach is to structure the data first with some kind of automation. By applying a structured schema to the data, we can more easily manage, query, and analyze the data.

Here's why structuring data before curation is a good idea:

  1. It reduces maintenance: By automating the schema creation and maintenance, you remove 80% of maintenance events of pipelines.
  2. It simplifies the data: By imposing a structure on the data, we can reduce its complexity, making it easier to understand, manage, and use.
  3. It enables automation: Structured data is more amenable to automated testing and processing, including cleaning, transformation, and analysis. This can significantly reduce the manual effort required to manage the data.
  4. It facilitates value extraction: With structured data, we can more quickly and easily extract valuable insights. We don't need to wait for the entire dataset to be curated before we start using it.
  5. It's more scalable: Reading structured data enables us to only read the parts we care about, making it faster, cheaper, and more scalable.

Therefore, adopting a 'structure first' approach to data management can help organizations more effectively leverage their unstructured data, minimizing the effort, time, and complexity involved in data curation and maximizing the value they can extract from their data.

An example of such a structured lake would be parquet file data lakes, which are both, structured and inclusive of all data. However, the challenge here is creating the structured parquet files and maintaining the schemas, for which the delta lake framework provides some decent solutions, but is still far from complete.

The better way

So, what if writing and merging parquet files is not for you? After all, file-based data lakes capture a minority of the data market.

dlt is the first python library in the open source to offer schema evolution

dlt enables organizations to impose structure on data as it's loaded into the data lake. This approach, often termed as schema-on-load or schema-on-write, provides the best of both worlds:

  1. Easier maintenance: By notifying the data producer and consumer of loaded data schema changes, they can quickly decide together how to adjust downstream usage, enabling immediate recovery.
  2. Consistency and quality: By applying structure and data typing rules during ingestion, dlt ensures data consistency and quality. This leads to more reliable analysis and insights.
  3. Improved performance: With schema-on-write, the computational cost is handled during ingestion, not when querying the data. This simplifies queries and improves performance.
  4. Ease of use: Structured data is easier to understand and use, lowering the skill barrier for users. They no longer need to understand the intricate details of the data structure.
  5. Data governance: Having a defined schema allows for more effective data governance. Policies for data quality, data privacy, and data lifecycle can be applied consistently and automatically.

By adopting a 'structure first' approach with dlt, organizations can effectively manage unstructured data in common destinations, optimizing for both, flexibility and control. It helps them overcome the challenges of schema-on-read, while reaping the benefits of a structured, scalable, and governance-friendly data environment.

To try out schema evolution with dlt, check out our colab demo.

colab demo

Want more?

  • Join our Slack
  • Read our schema evolution blog post
  • Stay tuned for the next article in the series: How to do schema evolution with dlt in the most effective way

This demo works on codespaces. Codespaces is a development environment available for free to anyone with a Github account. You'll be asked to fork the demo repository and from there the README guides you with further steps.
The demo uses the Continue VSCode extension.

Off to codespaces!

DHelp

Ask a question

Welcome to "Codex Central", your next-gen help center, driven by OpenAI's GPT-4 model. It's more than just a forum or a FAQ hub – it's a dynamic knowledge base where coders can find AI-assisted solutions to their pressing problems. With GPT-4's powerful comprehension and predictive abilities, Codex Central provides instantaneous issue resolution, insightful debugging, and personalized guidance. Get your code running smoothly with the unparalleled support at Codex Central - coding help reimagined with AI prowess.